Measurement with Fluoralys ®
The FLUORALYS® analyzer is based on the front fluorescence method applied directly to a raw sample. The acquisition of fluorescence spectra is performed like the description below :
- An excitation light (UV – visible ) from LED is sent on the sample.
- The light energy is absorbed by some molecules of the sample, but is also diffusely reflected by the particles of the same sample .
- Part of the light is re-emitted by the fluorescent molecules , such as proteins , vitamins and some pigments.
- The emitted light is collected by the ultra- sensitive spectrometer of the tool.
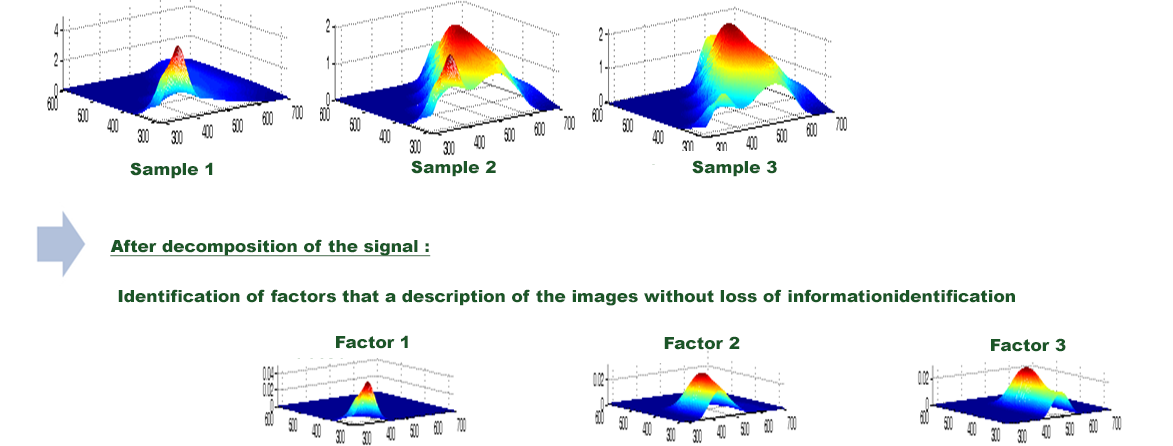
Fluorescence spectra are obtained by FLUORALYS® in 3 dimensions. These spectral images provide information on the physico-chemical state of the analyzed products (linked with nutritional , health criteria , sensorial parameters , etc. ). They are deeply modified by the process steps including heat treatment.
Modification of the spectral image of a product after a heat-treatment
These spectral images are decomposed using mathematical tools and algorithms developed specifically by Spectralys. These algorithms are automated and integrated into the software to allow the automatic analysis of spectra in order to extract useful information. In practice , the samples are associated with a set of variables (numbers from 5 to 13)that have specific values characterizing the samples. These values are the basis for the prediction of a parameter of interest thanks to a calibration model, or for a comparative measurement versus a reference.
Decomposition of the spectral image by Spectralys
One application is the development of a calibration model on a parameter of interest . This model is established on the same samples by acquiring spectra and conducting parallel measurement of the desired indicator by the reference method . A statistical model is then constructed between reference analyses and the fluorescence intensities of the variables generated from the fluorescence spectra decomposition. Subsequently , the parameter of interest is directly predicted in real time , through the calibration model . Thirty samples classed by variability factor are necessary for the establishment of a robust model . A second use of the overall fluorescence is a comparison to a reference sample. Spectral acquisition on a batch reference samples well selected according to the target are performed to characterize the target. Then, the spectral distance of a sample to this reference is automatically calculated. This calculation is based on statistical laws, here beta distribution for references and Qui2 for samples .


